
Test a trend rule on any market yourself.
Paste prices or type a symbol, and see in minutes how a trend-following rule would have done against buy & hold: return per year, Sharpe ratio, worst fall and time invested, with charts and every month in a table.
- 2 toolsExcel workbook and Python script
- Any marketstocks, ETFs, indices, gold, crypto
- 12 metricsfor the rule and for buy & hold
- No look-aheadcosts charged on every switch
One-off payment. Download right after payment, yours to keep.
Buy the templates →Download: .xlsx, .py, README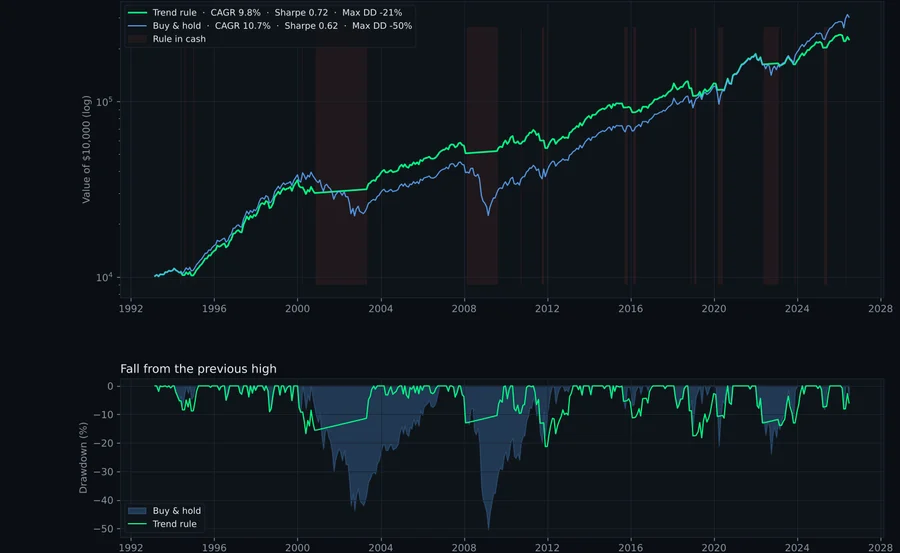 Sample output, S&P 500 1993–2026. Hypothetical backtest.
Two tools, one question: does the trend help on this market?
Excel workbook
Five sheets. Formulas only, no macros, so it opens anywhere.
- Start here: the 5-minute guide, the rules in plain words, a colour legend for inputs and formulas
- Data: paste dates and month-end prices (S&P 500 sample included); optional column for your own cash rate
- Settings: rule variant, signal length (2–36 months), cost per switch, cash return, start capital, market name
- Results: rule vs buy & hold side by side, the current signal for your market, and two charts (growth of the capital and the fall from the high)
- Backtest: the month-by-month calculation (up to 600 months), so you can check every number
Python script
One file, standard libraries: pandas, numpy, matplotlib, yfinance.
- Many markets in one run: any Yahoo Finance symbol (default: SPY, QQQ, GLD, TLT, BTC-USD) or your own CSV
- A 4-panel chart per market: growth of the capital, fall from the high, a monthly-returns heatmap and the distribution of monthly returns
- A CSV with every month per market, plus a summary table across all markets
- Robustness table: every market re-run with signal lengths from 3 to 18 months. A rule worth trusting works across most of them, not just one.
- Every setting on the command line: markets, rule variant, signal length, cost, cash rate, start date
What a result looks like
The sample run on the S&P 500 shows the typical trade-off of trend-following: a similar or slightly lower return per year, with a much smaller worst fall. On some markets the rule helps a lot, on others very little. That is exactly what the templates let you check for yourself.
| S&P 500, 1993–2026 | Trend rule | Buy & hold |
|---|---|---|
| Return per year | 9.8% | 10.7% |
| Sharpe ratio | 0.72 | 0.62 |
| Worst fall | −21.3% | −50.5% |
| Time invested | 80% | 100% |
Hypothetical backtest of the sample data with the default settings, monthly data, costs included. Not a forecast and not investment advice.
The 12 metrics on the Results sheet
Final value · total return · return per year · volatility · Sharpe ratio · worst fall · Calmar ratio · best month · worst month · positive months · time invested · number of switches, plus the current signal for your market.
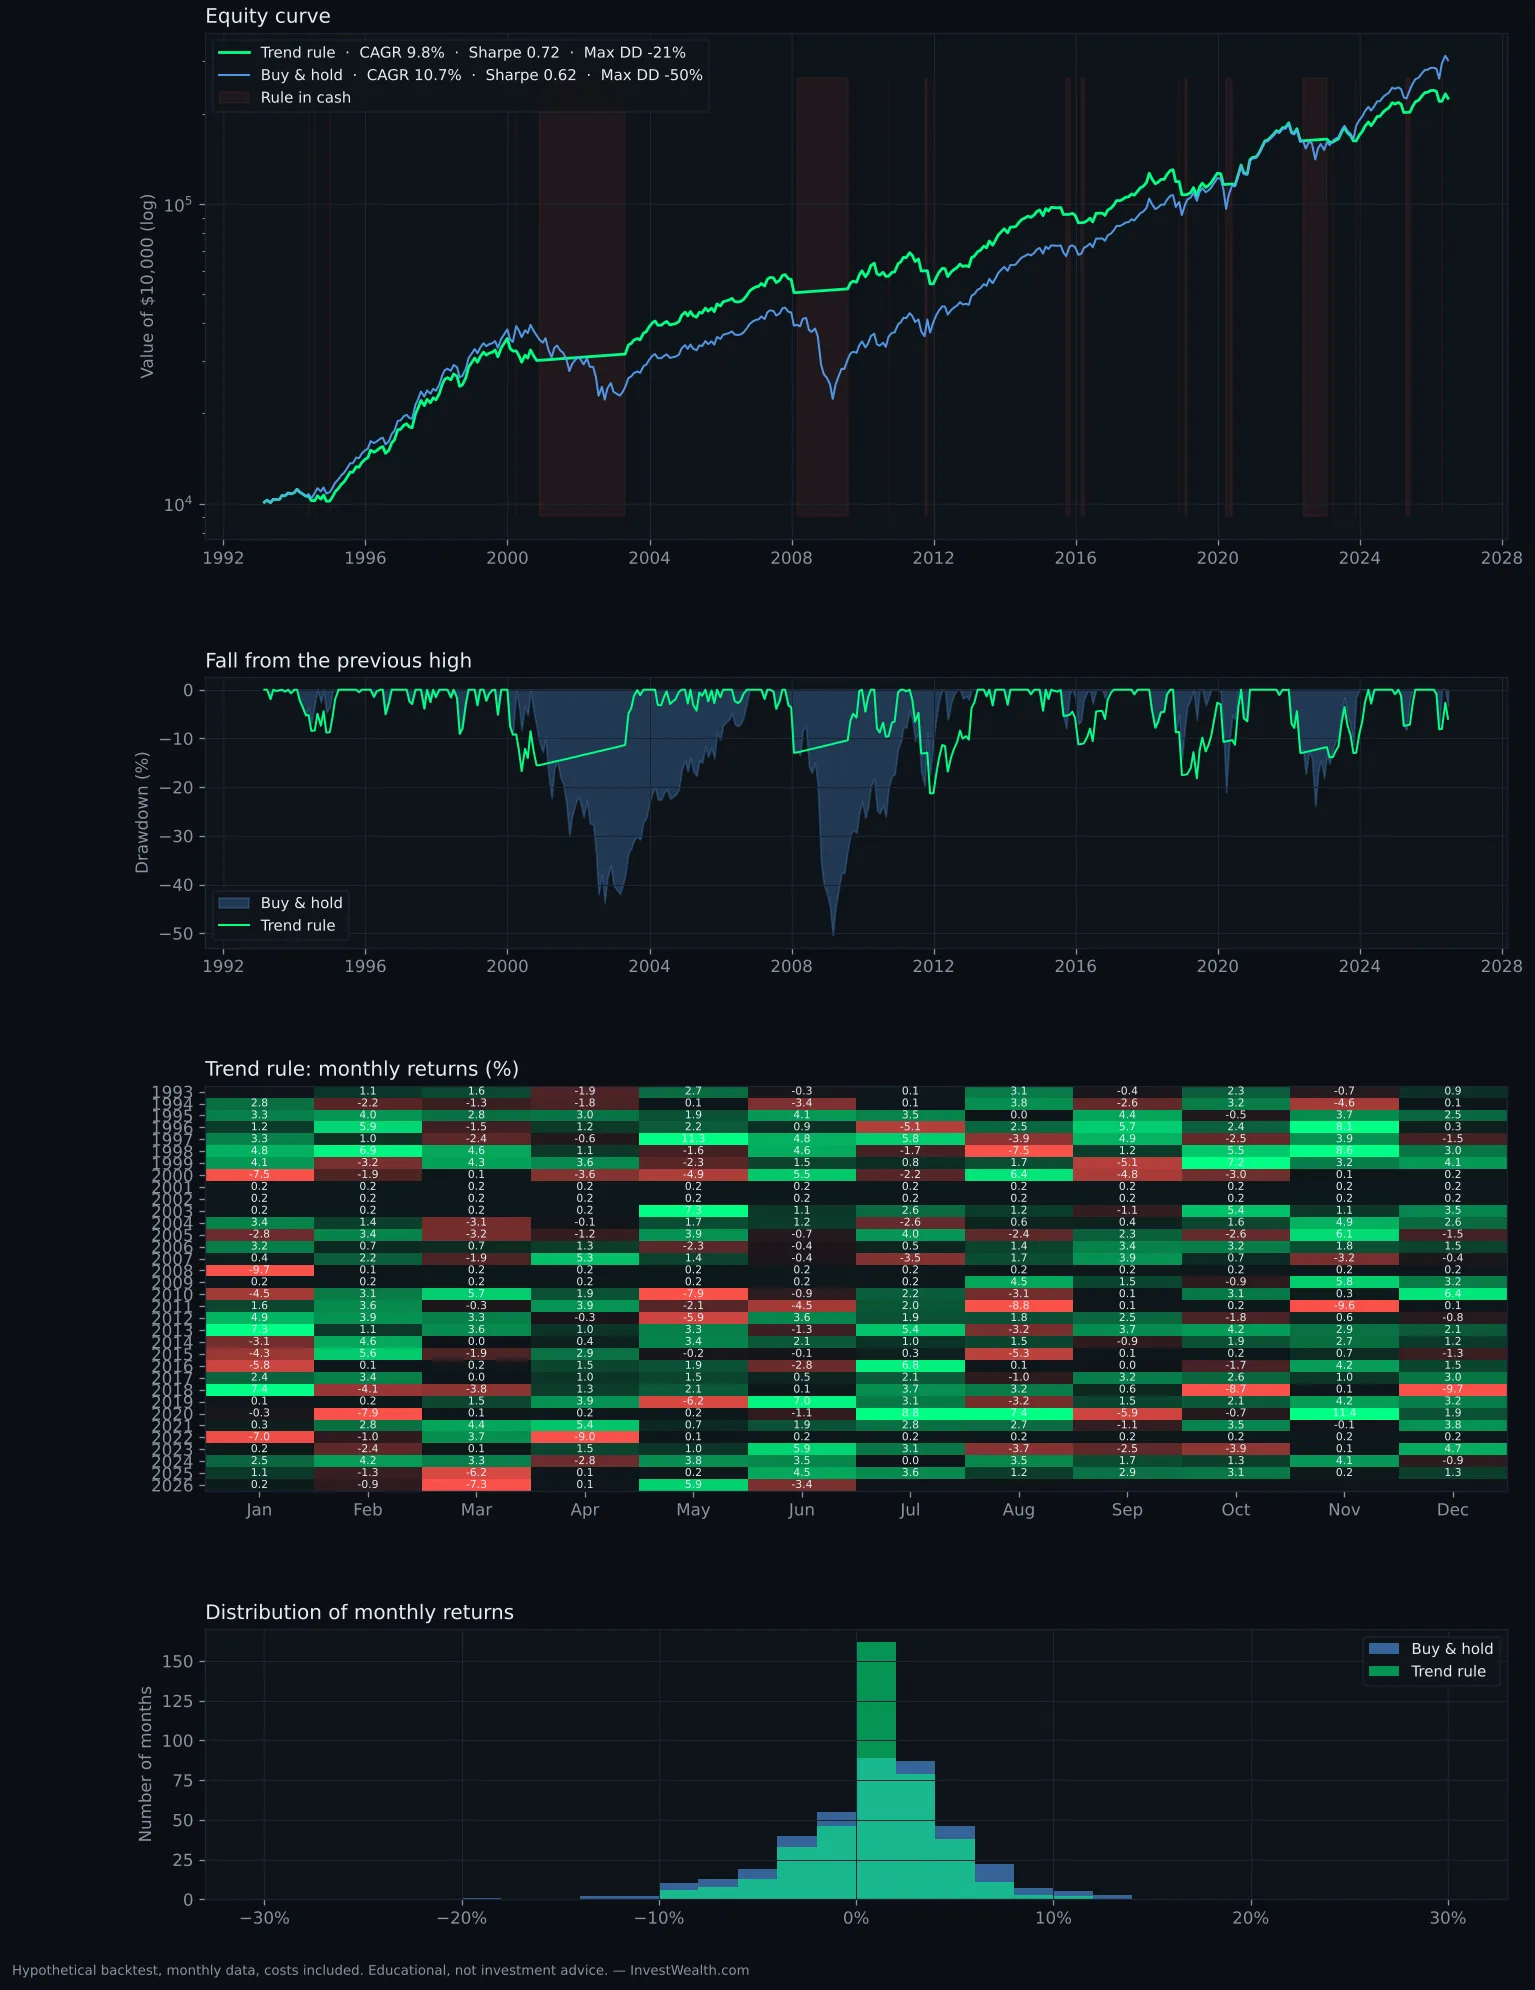 Python output, one chart per market. Click to enlarge.
Built for investors who want to check, not believe.
- You read about trend-following and want to see the numbers on your markets
- You hold an ETF, a stock or crypto and want to know how it behaved in its big falls
- You want a clean, documented starting point for your own research, without writing it from scratch
- You are learning Python and want a real, readable example of a backtest done right
Not for: anyone looking for buy and sell signals to follow. The templates measure; they do not tell you what to do.
From download to first result in about 5 minutes.
- Buy and download the ZIP right after payment (the link also comes by email).
- Excel: open the workbook, paste your prices on the Data sheet, read the Results sheet.
- Python:
pip install pandas numpy matplotlib yfinance, then run the script with your symbols. - Compare the rule with buy & hold, then run the robustness table before you trust any single result.
Requirements
- Excel 2016 or newer, Excel for Mac, LibreOffice or Google Sheets
- Python 3.9+ with pandas, numpy, matplotlib (and yfinance for downloads)
- Formats: .xlsx, .py, .csv, .md, .png, delivered as one ZIP
Frequently asked
Do I need to know how to code?
No. The Excel workbook needs no code at all: paste month-end prices into one sheet, pick the settings in yellow cells, and the results, the current signal and the charts update by themselves. It also opens in Google Sheets. The Python script is there for those who want to test many markets in one run.
Which markets can I test?
Any market with monthly prices. In Excel you paste the prices yourself (from your broker, a data site or the sample file). The Python script downloads any symbol Yahoo Finance knows: stocks, ETFs, indices, currencies and crypto, or reads your own CSV file.
Is this the InvestWealth strategy?
No. The templates test a public, textbook trend rule (two variants) so you can see for yourself what trend-following does on a market: usually a similar or slightly lower return with much smaller falls, and on some markets very little benefit. The strategies in the Research Terminal use their own, undisclosed rules.
Is there look-ahead in the results?
No. The signal is calculated with the month-end price of one month and applied to the following month. A cost is charged on every switch, and the cash rate is earned while the rule is out of the market.
What do I get after payment?
A ZIP download right away: the Excel workbook, the Python script, a README with step-by-step instructions, sample data (S&P 500 total return, monthly, 1993–2026) and a sample output chart. You also get the link by email.
Can I share the files?
They are licensed for your personal use. Please do not redistribute them.
Are the results a prediction?
No. Every backtest is hypothetical: it uses idealised month-end execution, ignores taxes and is run with hindsight. Past results do not tell you what will happen next. The templates are educational tools, not investment advice.
Run your first backtest today.
Excel workbook, Python script, README, sample data and sample output. One payment, no subscription.
Educational tools, not investment advice. Backtests are hypothetical: idealised month-end execution, no taxes, chosen with hindsight. Past results do not indicate future results. Legal