Institutional-grade order-flow analytics for Bitcoin, Ethereum and Solana.
Price is the outcome; order flow is the cause. Crypto Flows is the order-flow framework we developed at InvestWealth for our own decisions. It works trade by trade: it classifies every single trade by its aggressor side across four spot and six perpetual-futures markets, aggregates it in US dollars every two seconds, and sets it against the liquidity it trades into: depth, funding, open interest and liquidations. On top sits our own price-impact model: how many dollars of net buying it takes to move each coin 1 %. One screen for who is paying the spread, with what capital, and what it does to the price.
In final testing. The waitlist gets it first; nothing is charged before it opens.

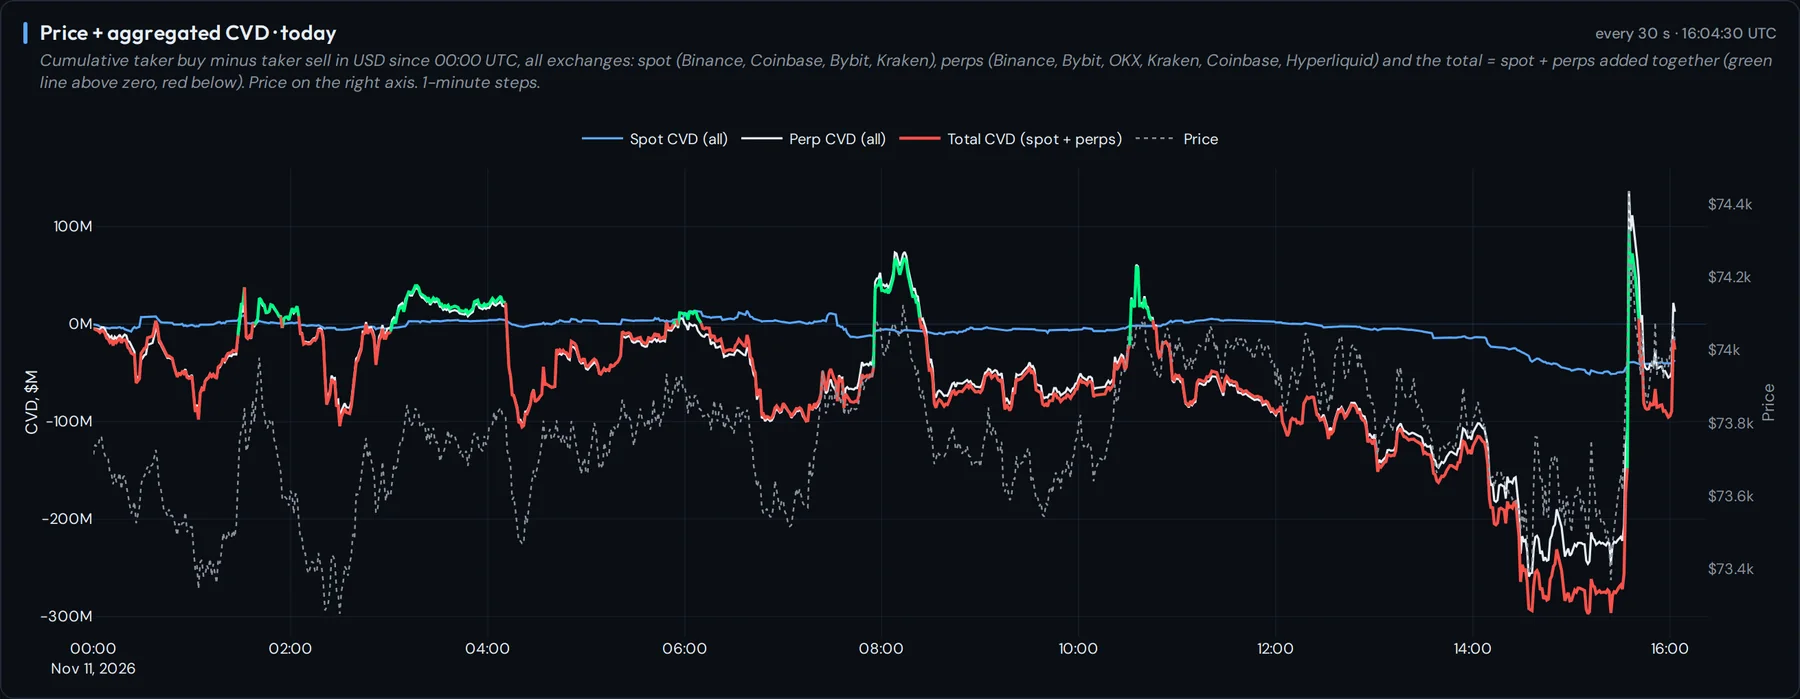
The product itself, not a mock-up: Bitcoin, 11 Nov 2026, 00:00 to 16:04 UTC. Every screen on this page is the live Terminal with that day's data.
Every single trade, on ten markets, as it happens
Crypto Flows is not built from candles or from an exchange's summary. Our own server receives every trade of Bitcoin, Ethereum and Solana from ten markets, classifies each one by its aggressor side and adds it up in US dollars. On an ordinary day that is about 20 million trades and more than $60 billion of volume.
When the market breaks out, the stream explodes. On 10 November 2026 at 13:30 UTC, Binance perpetual futures alone printed about 147,000 trades in Bitcoin and Ethereum, worth $1.6 billion, in a single minute. Across all ten markets that minute held 737,000 trades and $3.5 billion; the busiest two seconds held 83,000 trades and $549 million. This is the moment order flow matters most, and the moment it is hardest to capture completely.
Our own record, 9 to 10 November 2026, UTC. Binance reports all fills of one order at one price as one trade, so the number of individual fills is higher still.
Three questions, measured rather than guessed.
Seven views of the same tape.
Each one is a panel of the Crypto Flows tab. Click a screen to open it full size.
Aggregated CVD against price
The core view. Spot CVD, perpetual CVD and their total, in US dollars, against price: 2-second steps intraday, hourly over 30 days, daily beyond. Read divergences directly: price making highs on falling CVD (passive sellers absorbing), or price holding while takers sell (a bid underneath).
- Per coin, and "All 3" as one aggregate crypto tape
- Spot share of volume: who leads, cash or leverage
- Per-exchange CVD: where the flow originates
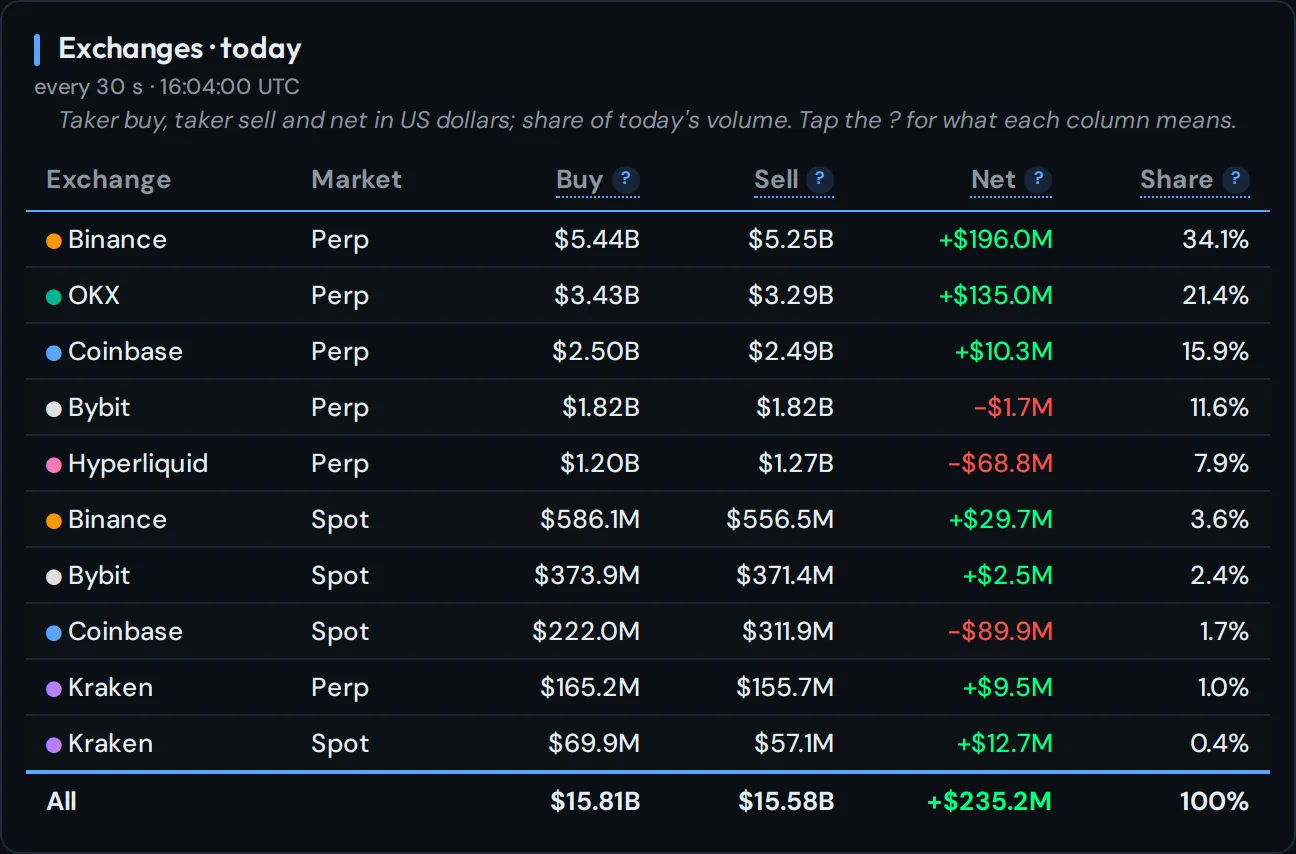
Venue decomposition
Taker buy, taker sell, net and share of volume for each of the ten markets. Flow migrates: a Coinbase spot bid against Binance perp selling is a different market from the reverse. The table shows it in one glance, the per-exchange CVD charts over time.
- Binance, Coinbase, Bybit, Kraken (spot)
- Binance, Bybit, OKX, Kraken, Coinbase, Hyperliquid (perpetuals)
- Flow composition: spot-led or leverage-led, absorption flags
Price impact of net flow: our own measure
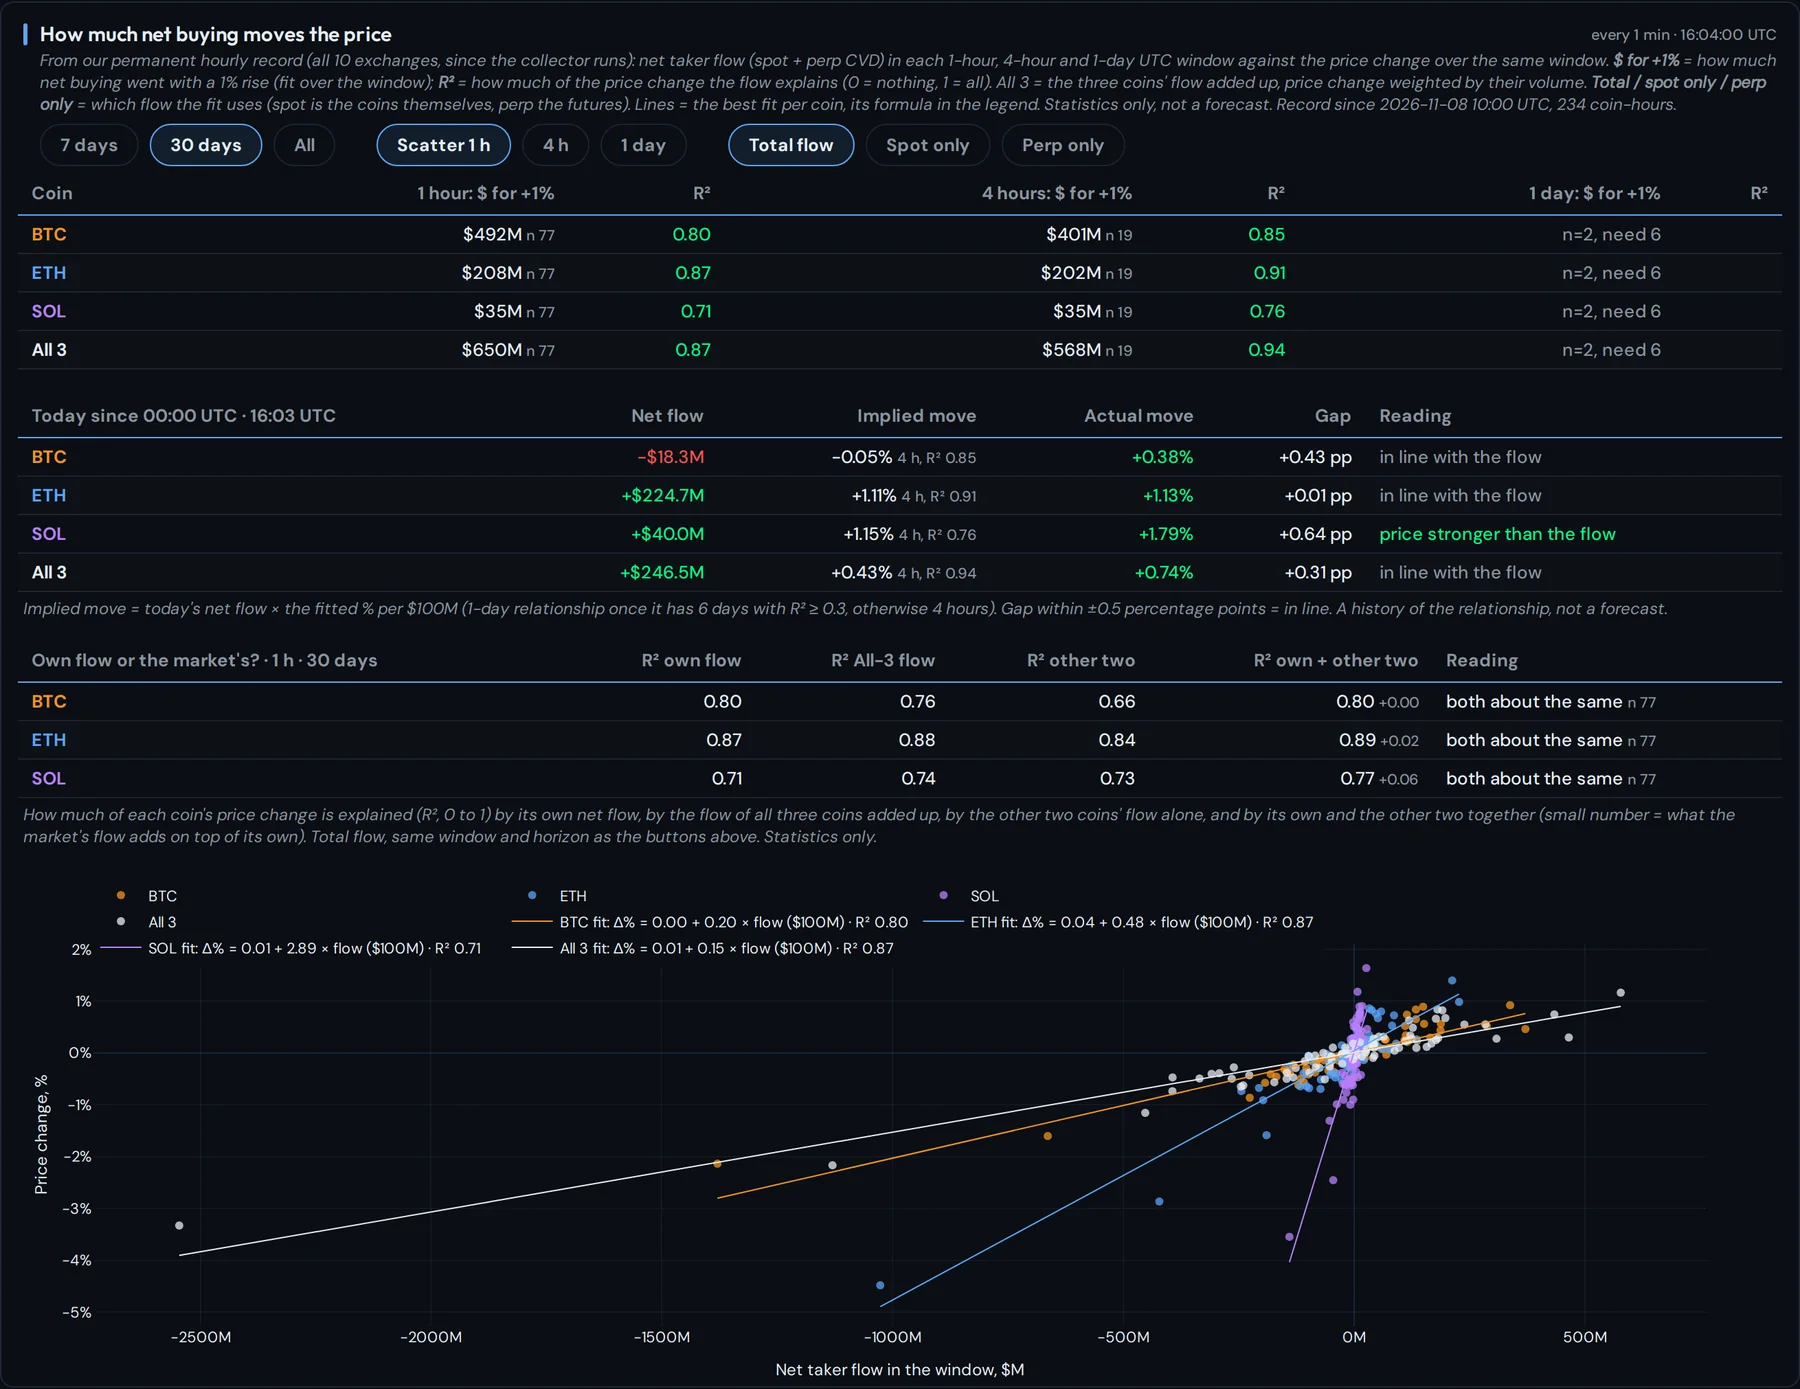
How much net taker flow moves the price: a measure we developed ourselves and have not seen on any other platform. From our own permanent record we regress the price change on the net flow of the same window and report the slope as dollars per 1 %, with R² and the fitted line, for 1-hour, 4-hour and 1-day windows, for total, spot-only and perp-only flow. Today's realised move is set against the move the flow implies, and each coin is tested against its own flow and the market's.
- $ of net flow per 1 % move, with R², per coin and aggregate
- Implied vs realised move today: is price richer or cheaper than its flow
- Own-flow vs market-flow R²: idiosyncratic or beta
Funding and leverage
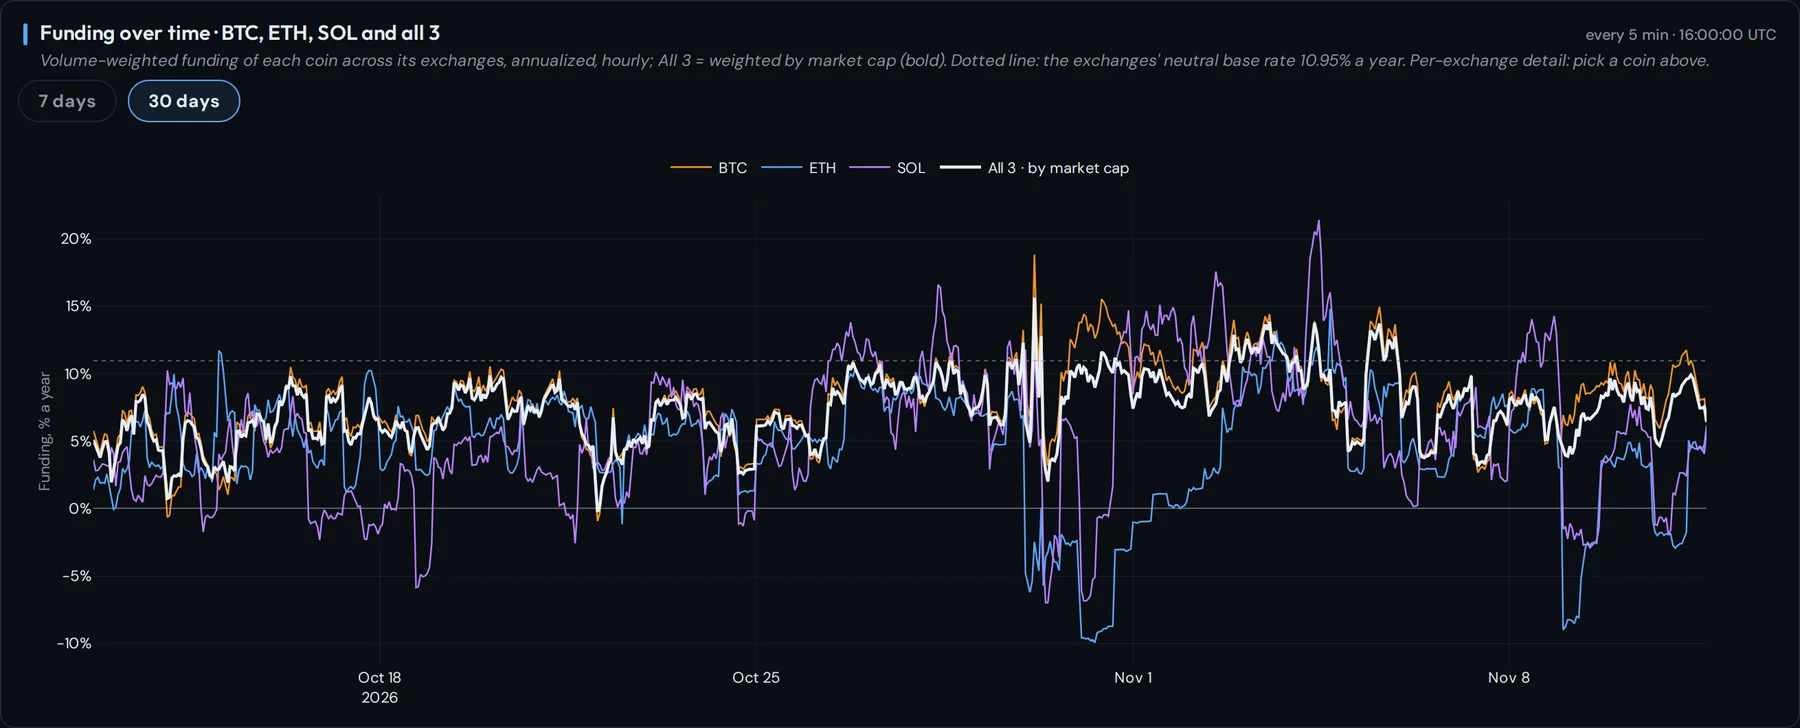
What the leverage costs and how much of it there is. Funding per exchange, annualised by each venue's own payment interval and volume-weighted across six venues, with history; open interest across five venues on a like-for-like basis; account long/short ratios and Binance liquidations as they print.
- Funding: 6 venues, volume-weighted, vs the 10.95 % neutral base rate
- Open interest: Binance, Bybit, OKX, Hyperliquid, Bitget
- Liquidations by side, live and by hour
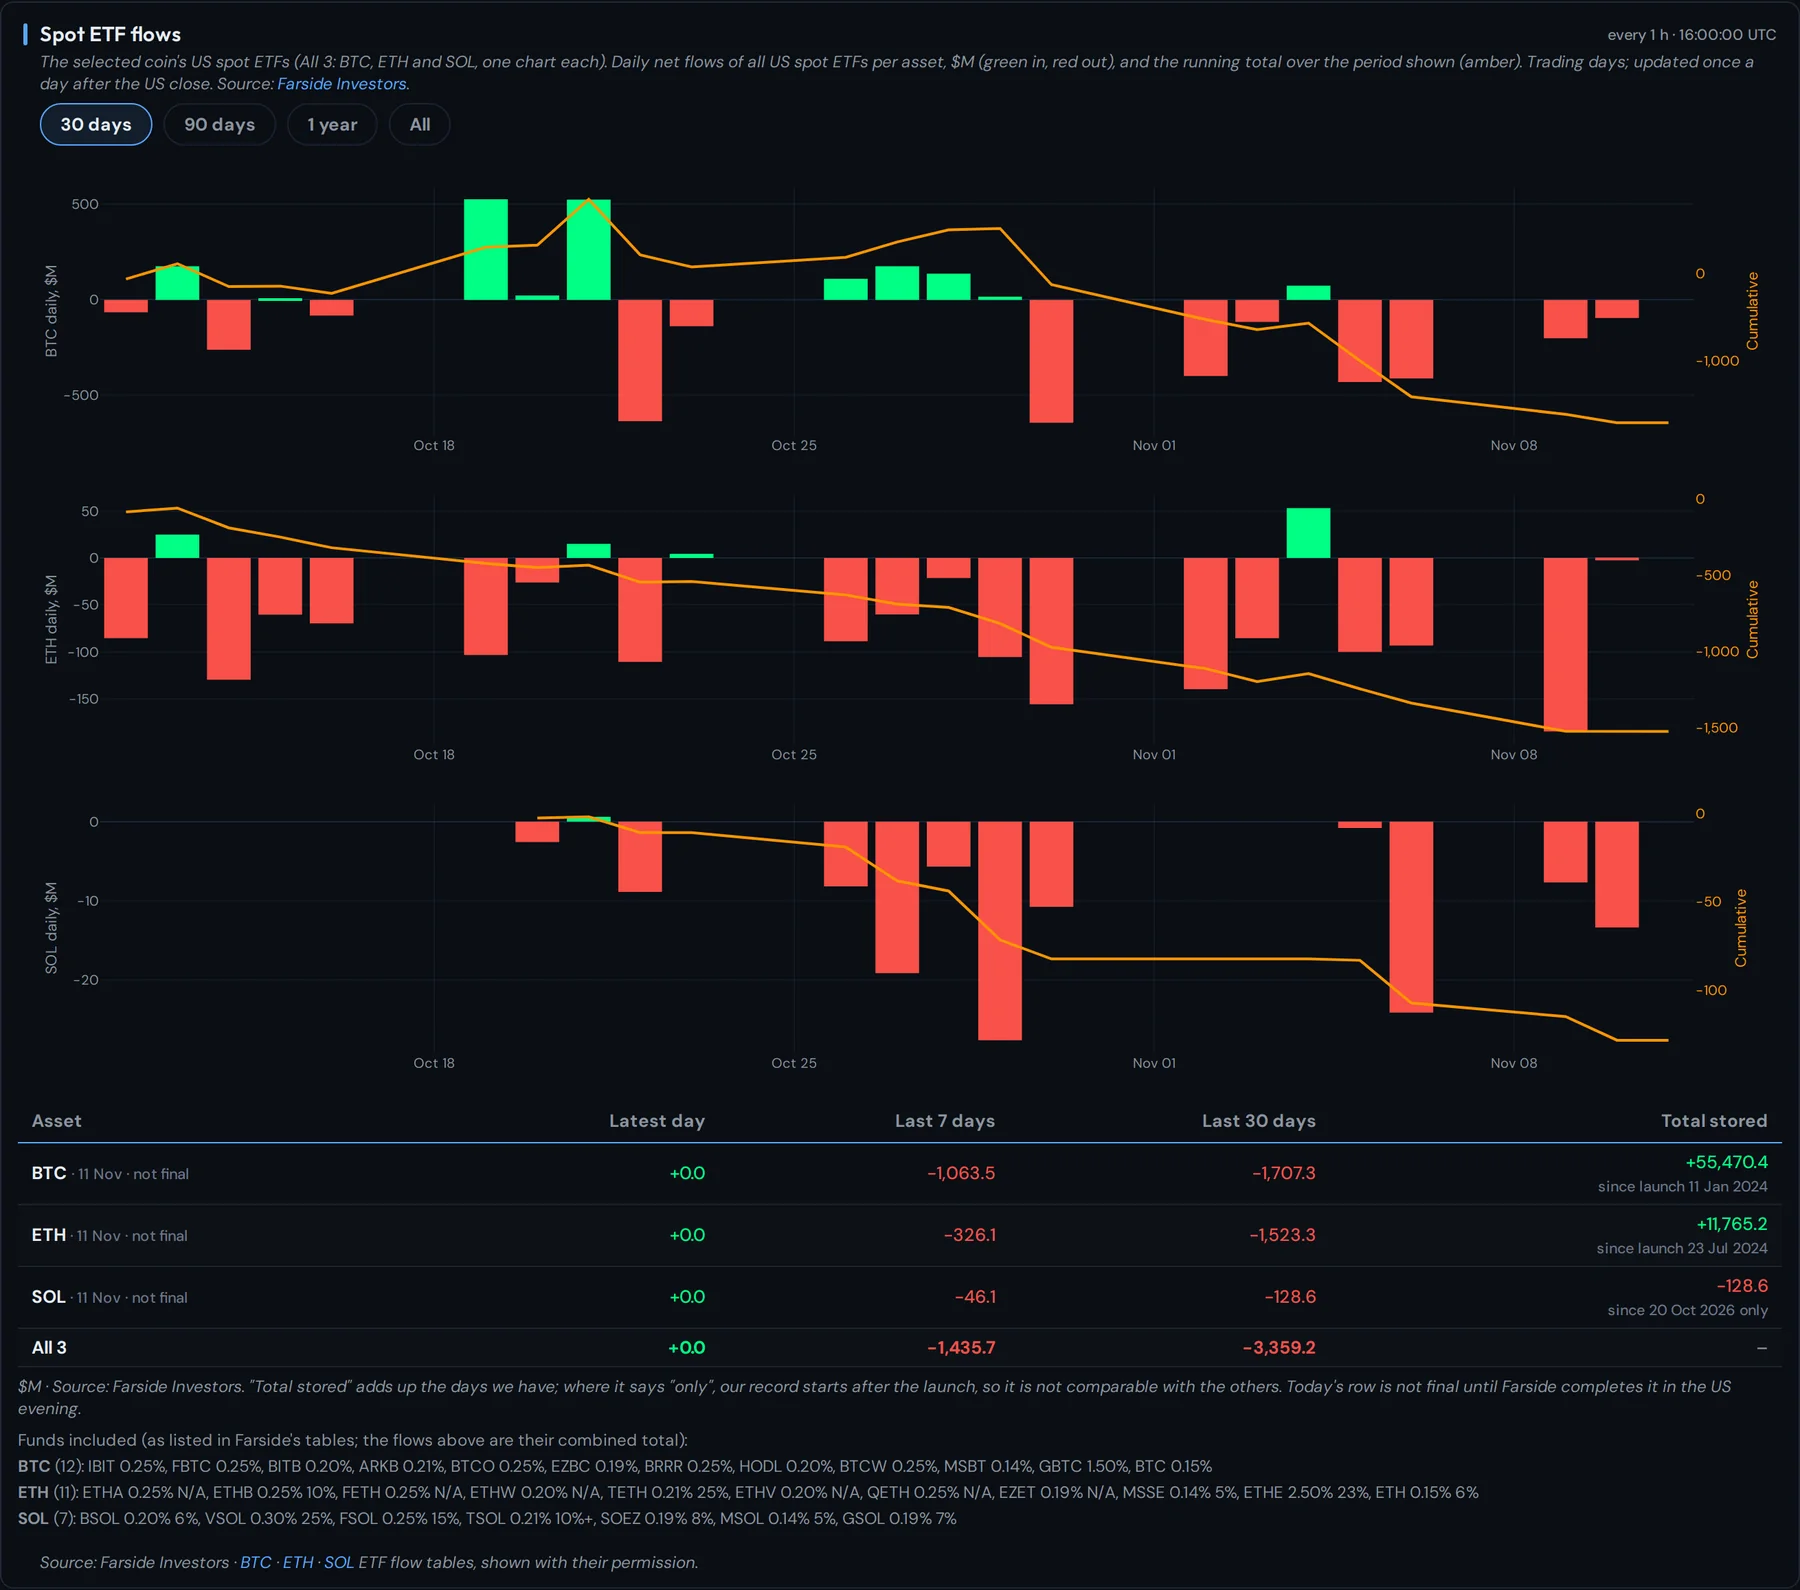
Order-book depth
The liquidity the flow trades into. Resting bids and asks within ±1, ±2, ±5 and ±10 % of mid on Binance spot, Binance perp and Coinbase, sampled every minute, with the bid/ask balance per band. Impact is flow over depth: thin books are where modest flow travels far.
- Four depth bands, bids and asks, per coin and aggregate
- Bid/ask balance per band
- 1 day at 1-minute steps, up to 30 days
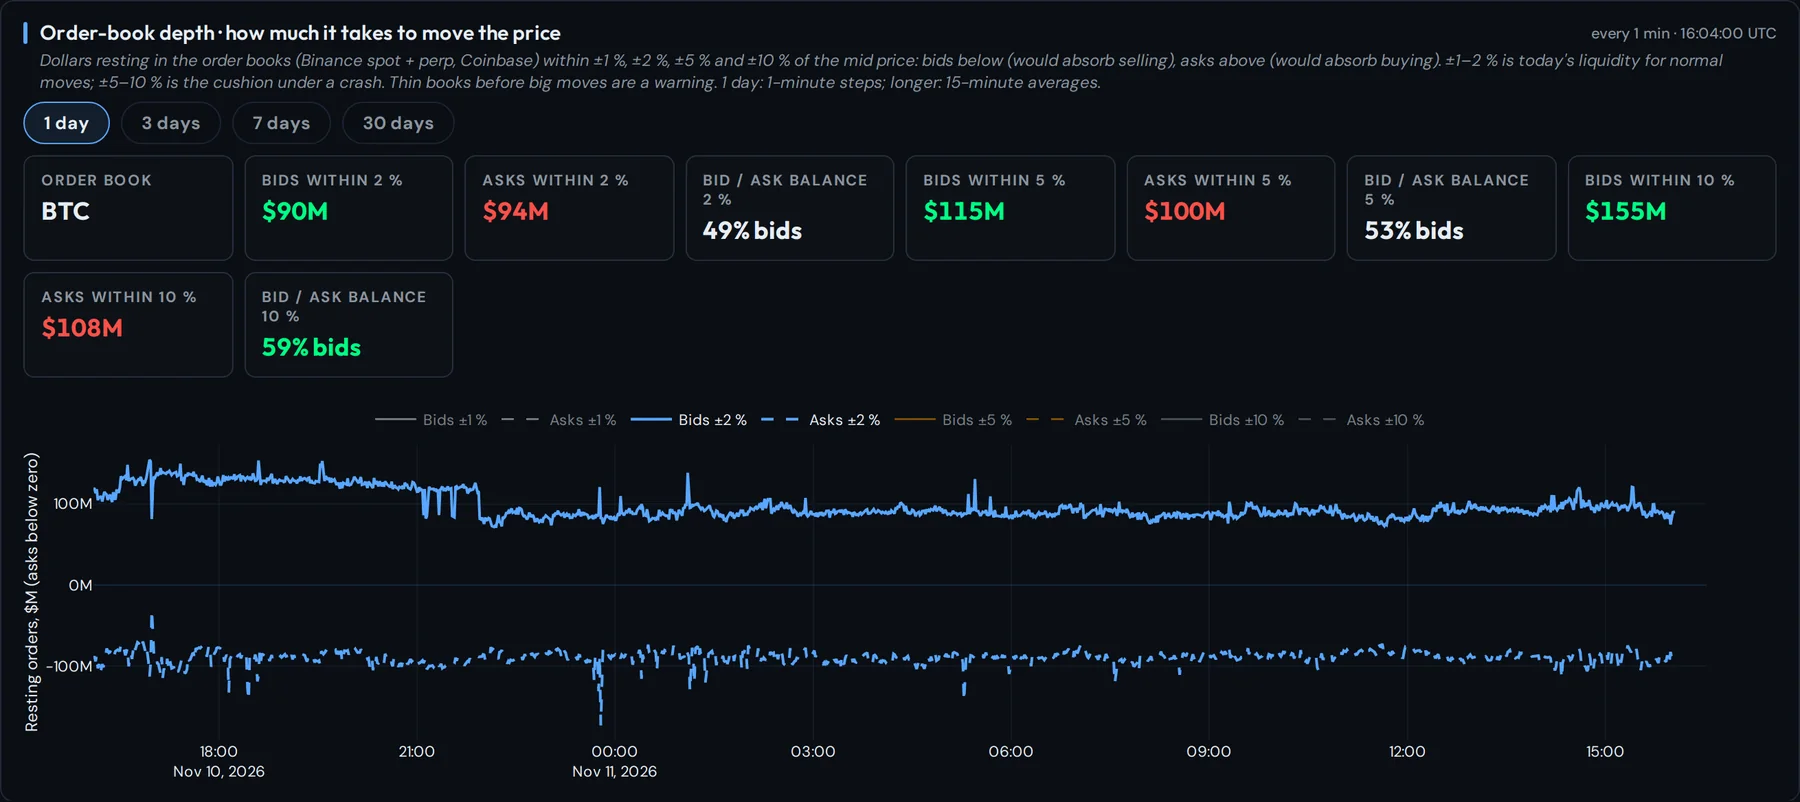
Flow toxicity (VPIN)
Volume-synchronised probability of informed trading (Easley, López de Prado and O'Hara, 2012) on a volume clock: 50 equal-volume buckets a day, the order imbalance averaged over the last 50, in both the exact (trade-level) and bulk-classified variants, with its empirical percentile. Persistently one-sided volume is the condition under which market makers withdraw. The measure comes from the study of the US equity flash crash of 6 May 2010: its authors reported that order flow had turned toxic well before the crash. We ran the same measure over the crypto crash of 10 October 2025: Bitcoin's reading reached the top 1 % of its trailing year about two hours before the low, while Ethereum and Solana gave no early signal. We therefore show it as a gauge of stress in the order flow, not as a crash alarm.
- Developed after the 2010 flash crash; tested by us on the crypto crash of 10 October 2025
- Exact and BVC variants, with the CDF and the 90th and 99th percentile thresholds
- Binance perpetuals, 1-minute updates
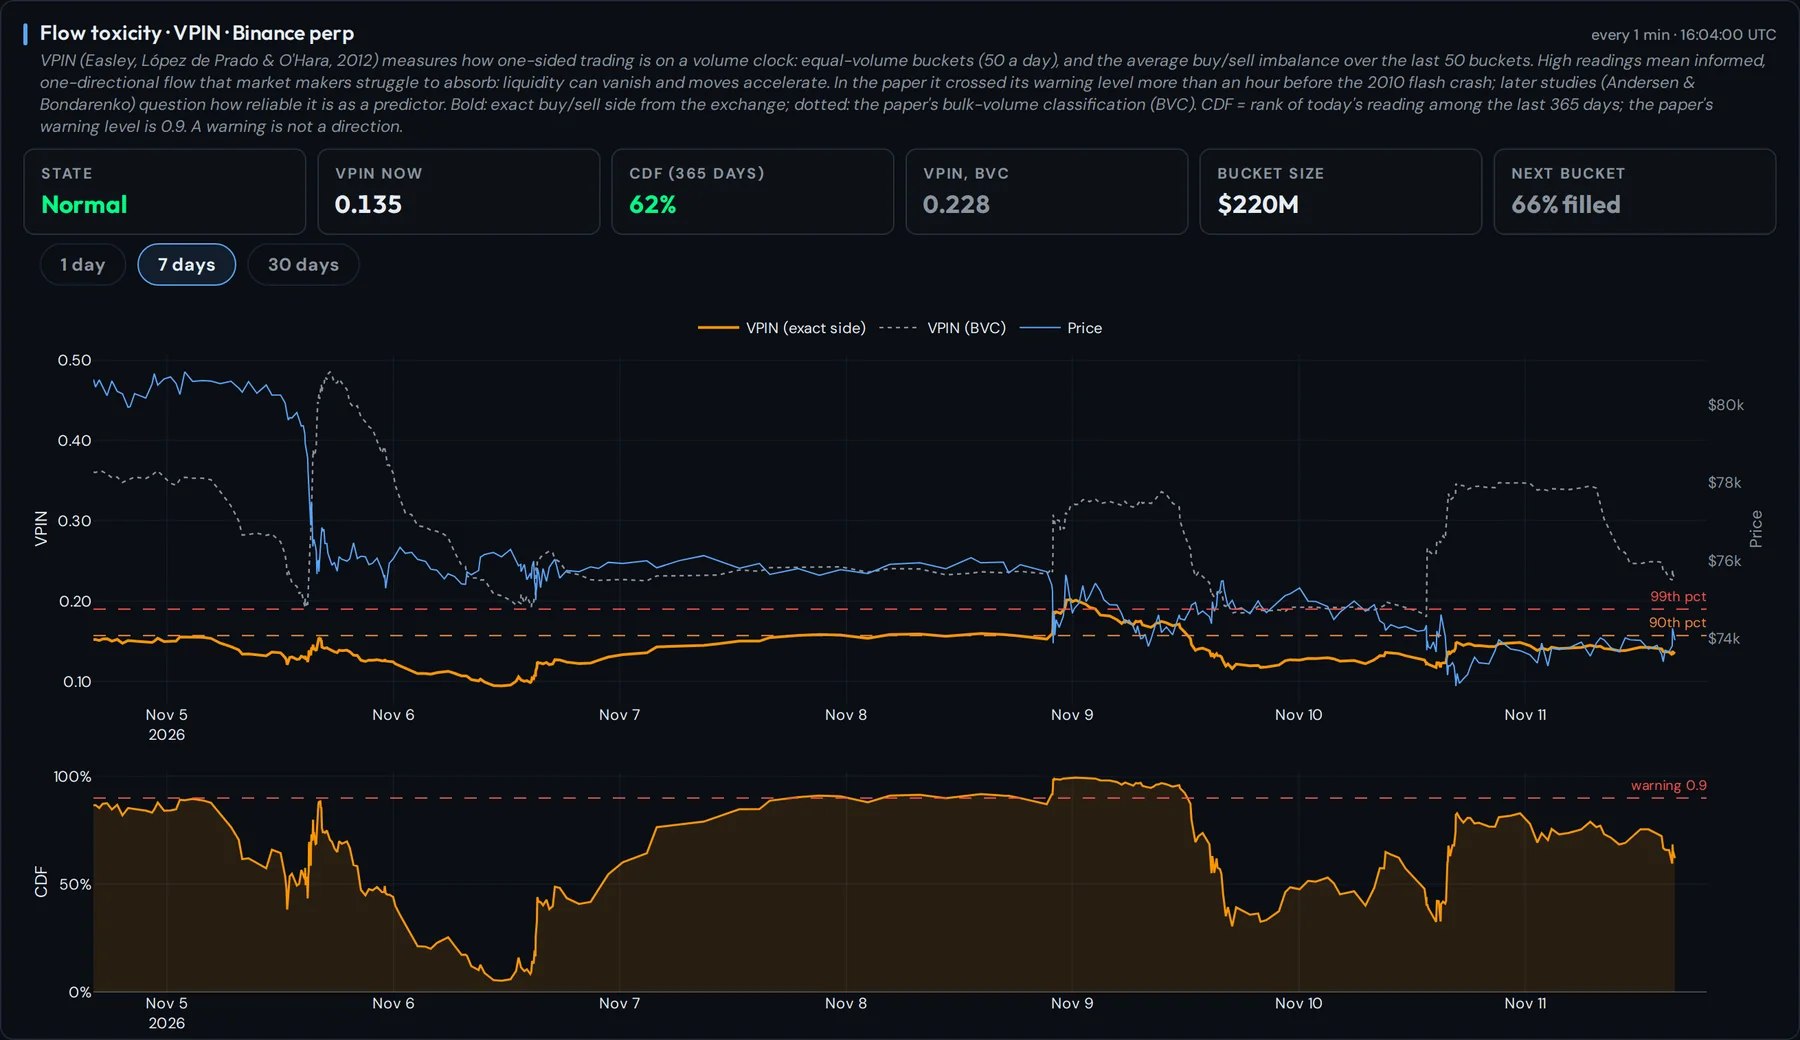
US spot ETF flows
The slow, unlevered money next to the fast flow: daily net creations and redemptions of the US spot Bitcoin, Ethereum and Solana ETFs, with the running total over 30 days to the full history. Source: Farside Investors.
- BTC, ETH and SOL funds, daily
- Running total over 30, 90, 365 days or all
- Latest day, 7-day and 30-day sums
What is measured, and where.
| Data | Venues | Frequency |
|---|---|---|
| Spot trades (aggressor side) | Binance, Coinbase, Bybit, Kraken | every trade · 2 s and 1 min bars |
| Perpetual-futures trades (aggressor side) | Binance, Bybit, OKX, Kraken, Coinbase, Hyperliquid | every trade · 2 s and 1 min bars |
| Funding rates | Binance, Bybit, OKX, Kraken, Coinbase, Hyperliquid | each payment, checked every 5 min |
| Open interest, long/short accounts | Binance, Bybit, OKX, Hyperliquid, Bitget | 5 min |
| Order-book depth (±1, 2, 5, 10 %) | Binance spot, Binance perp, Coinbase | 1 min |
| Liquidations | Binance perpetuals | as they print |
| VPIN | Binance perpetuals | 1 min |
| US spot ETF flows | all US spot BTC, ETH and SOL funds (Farside Investors*) | daily |
All series are collected on our own server from the exchanges' public feeds and kept permanently, so every statistic on the desk is computed from our own record.
* ETF flow data from Farside Investors, shown with their written permission.
Crypto Flows
The complete order-flow desk in the Research Terminal for 12 months.
Join the waitlistPrivate
Crypto Flows, everything in Premium, the hedging framework for all 30 markets and a private session a year with Dr. Harry Hamann.
See PrivateQuestions a desk would ask
How is the cumulative volume delta (CVD) computed?
Every trade is classified by its aggressor side as reported by the exchange: a taker buy lifts the offer, a taker sell hits the bid. Per market we sum taker buy notional minus taker sell notional in US dollars; the CVD is the running total. Nothing is inferred from candles (no tick rule, no bulk classification) for the order-flow views.
What exactly are the "10 markets"?
Four spot markets (Binance, Coinbase, Bybit, Kraken) and six perpetual-futures markets (Binance, Bybit, OKX, Kraken, Coinbase, Hyperliquid) for each of Bitcoin, Ethereum and Solana: ten order books per coin on six exchanges, 30 trade streams in total, normalised to US dollars and aggregated.
Why keep spot and perpetuals apart?
They are different capital. Spot flow is fully funded and changes who owns the coins. Perpetual flow is margined: it builds open interest, pays funding and can be forced out by liquidation. The same price move reads very differently depending on which of the two carried it, so every view shows spot, perp and the total.
How much data is behind it?
Every trade of Bitcoin, Ethereum and Solana on ten markets: about 20 million trades and more than $60 billion of volume on an ordinary day (9 and 10 November 2026). In a breakout the stream multiplies: on 10 November 2026 at 13:30 UTC one minute held 737,000 trades and $3.5 billion, of which Binance perpetual futures alone printed about 147,000 trades in Bitcoin and Ethereum.
What is VPIN, and does it predict crashes?
VPIN (volume-synchronised probability of informed trading) was developed by David Easley, Marcos López de Prado and Maureen O'Hara. It measures how one-sided trading is on a volume clock, and became known through their study of the US equity flash crash of 6 May 2010, where they reported toxic order flow well before the crash. Other researchers have disputed its value as a predictor. Our own test on the crypto crash of 10 October 2025 gave a mixed result: Bitcoin's reading reached the top 1 % of its trailing year about two hours before the low, Ethereum and Solana gave no early signal, and in the year before, such readings in Bitcoin were not followed by a large fall. We show it as a gauge of stress, not as an alarm.
What resolution and history?
Today in 2-second steps, with 1-minute bars stored permanently since 8 November 2026 (Binance spot and perp reach back further from exchange archives). Funding, open interest and order-book depth are recorded every 1 to 5 minutes and also kept for good. The impact statistics are re-estimated from this record every 15 minutes.
How is price impact estimated?
Ordinary least squares of the price change on the net taker flow of the same window (1 hour, 4 hours, 1 day), per coin and for the three together, for total, spot-only and perp-only flow. We report the slope as dollars of net flow per 1 % move, the R², the fitted line with its formula, and today's realised move against the move the flow implies.
Is this a trading signal?
No. It is measurement: who traded, with what kind of capital, into how much liquidity, and what it did to the price. It is not a forecast and not investment advice.
How does it relate to Private?
Crypto Flows is the order-flow desk on its own. Private ($2,249 a year) includes it, together with everything in Premium, the hedging framework and a private session a year with Dr. Harry Hamann.
Crypto Flows is market data and education, not investment advice and not a trading signal. Crypto assets are highly volatile and you can lose all of your money. ETF flow data: Farside Investors. Terms.