
The trillion-dollar IPO wave
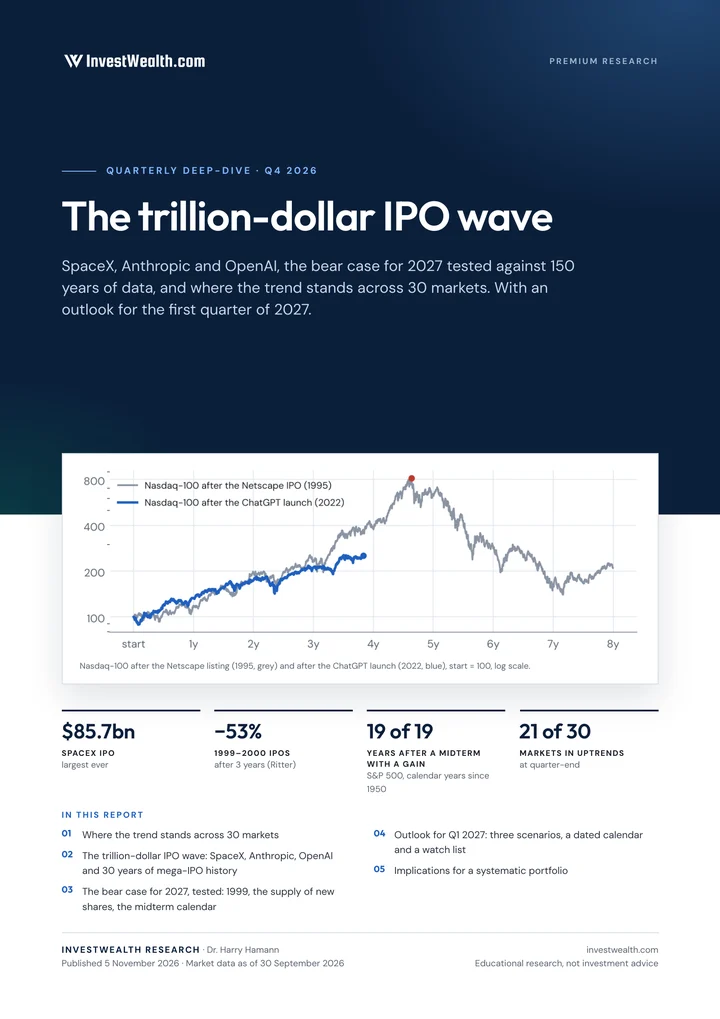
2026 is the year the largest private companies in the world started coming to the stock market. We put the wave in the context of 30 years of IPO history and 150 years of market data, test the bear case for 2027, and show where the trend stands across 30 markets.
- $85.7bnSpaceX IPO, June 2026: the largest ever
- −53%average return of 1999–2000 IPOs over three years (Ritter)
- 19 of 19years after a midterm election with an S&P 500 gain, since 1950
- 42 sourcescited in the text where each claim is made
What's inside
- Where the trend stands across 30 markets. Stocks, bonds, gold, oil, currencies and crypto: which markets are in an uptrend, how broad the advance is, and where it is narrowing.
- The trillion-dollar IPO wave. SpaceX, Anthropic and OpenAI, and 30 years of mega-IPO history: what happened to the biggest listings after the first-day jump.
- The bear case for 2027, tested. In a CNBC interview on 13 October 2026, Paul Tudor Jones warned that 2027 could be a very difficult year for stocks. We test his argument against the data: the comparison with 1999, the supply of new shares, and the midterm calendar.
- Outlook for Q1 2027. Three scenarios, a dated calendar of the events that matter, and a watch list of indicators you can follow in the Research Terminal.
- Implications for a systematic portfolio. What the findings mean for an investor who follows rules rather than headlines.
Read the executive summary free
Open a free account and the executive summary and key takeaways are yours on Thursday 5 November, in your account and by email. The account also unlocks the Research Terminal: 30 markets, the crash test and the 4% rule calculator. No card required.
Open free account Log inThe full report: pre-order
All 27 exhibits, the bear case tested point by point, three scenarios for Q1 2027 with a dated watch list, and what it means for a systematic portfolio. Pre-order now and the PDF is emailed to you on Thursday 5 November. Included in Premium.
Measurements, not forecasts.
Every Deep-Dive takes one theme, checks it against the longest data we have, and shows the source of every chart and table. We describe what the data show and what would change the picture; we do not tell you what to buy or sell.
Open the Research Terminal See plansOne Deep-Dive every quarter
- One theme, backed by up to 150 years of data
- Charts and tables with their source
- Scenarios and a dated watch list for the next quarter
- What it means for a systematic portfolio
Educational research, not investment advice. Past returns do not guarantee future results. The published edition uses market data to the end of October 2026; figures on this page are as of 30 September 2026.