
Why are bond prices and interest rates inversely related?
Why bond prices fall when interest rates rise, how much a 1-point move costs by maturity, and what it meant in 2022, when long Treasuries fell 31%.
In 2022, long-term US Treasuries (US government bonds) lost 31.2 %, their worst calendar year in our data from 2003 to 2025. The S&P 500, the index of the 500 largest US companies, fell about 18 % in the same calendar year. The asset that is called safe fell further than stocks, and the reason fits in one sentence: interest rates rose. This guide explains why bond prices and interest rates are inversely related, how much a rate change moves a price, and what that means for a bond holding.
What a bond is, in four lines
A bond is a loan. The buyer receives a fixed interest payment every year, called the coupon, and gets the money back on a set date, called maturity. Neither changes after the bond is issued. What can change is the price at which the bond trades before maturity.
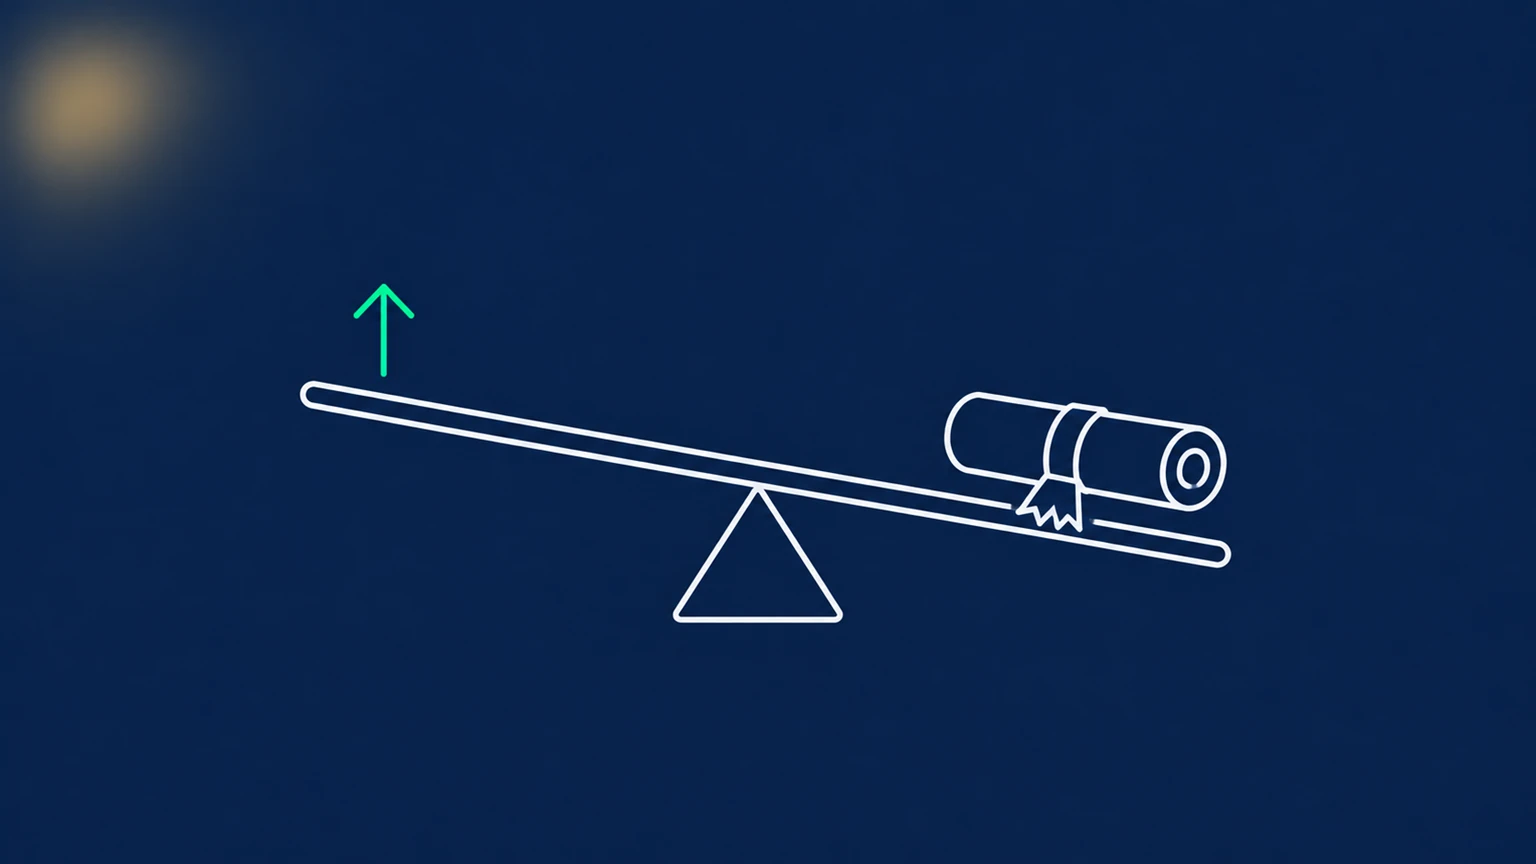
An everyday comparison: picture a contract that pays a fixed amount every year. If new contracts for the same money start paying more, nobody pays full price for the old one; its price falls until a buyer earns as much on it as on a new one. If new contracts pay less, the old one becomes the better deal, and buyers pay more for it.
That is the inverse relationship between bond prices and interest rates. The return a buyer earns at today's price is called the yield, and the price is the only thing that can move to bring the yield of an old bond into line with new ones. The US Securities and Exchange Commission puts the rule into the title of its investor bulletin on fixed income investments: when interest rates go up, prices of fixed-rate bonds fall.
A worked example with $1,000
Take a 10-year bond with a face value (the amount repaid at maturity) of $1,000 and a 3 % coupon. It pays $30 a year for ten years and returns the $1,000 at the end. On the day it is issued, new 10-year bonds also pay 3 %, so it trades at $1,000.
Then market rates move. The old bond still pays $30 a year, so its price adjusts:
| Market rate for new bonds | Price of the 3 % bond |
|---|---|
| 2 % | about $1,090 |
| 3 % | $1,000 |
| 4 % | about $919 |
| 5 % | about $846 |
Read the 4 % line. A buyer who pays $919 receives $30 a year and, at maturity, $1,000. The coupons plus that gain of about $81 add up to a yield of 4 % a year, which is what a new bond pays. Above $919 the new bond is the better deal; below it, the old one is. So the price settles there.
Nothing about the bond itself changed: same issuer, same coupon, same repayment. Only the rate on offer elsewhere changed.
For readers who want the formula: the price is the present value of the coupons plus the present value of the face value, each discounted at the market rate. That one line is the relationship between bond prices and interest rates.
*Illustration, annual coupons, no costs or taxes.*
Why maturity matters: duration
A one-point rise in rates does not move every bond by the same amount. Keep the 3 % coupon and let market rates rise from 3 % to 4 %:
| Bond | Price after the rise | Change |
|---|---|---|
| 2-year | about $981 | about −1.9 % |
| 10-year | about $919 | about −8.1 % |
| 30-year | about $827 | about −17.3 % |
The longer the money is locked in at the old rate, the bigger the price change. The holder of the 2-year bond can reinvest at 4 % after two years. The holder of the 30-year bond is tied to 3 % for three decades, and the price has to make up for all of them at once.
Duration puts that sensitivity into one number. The rule of thumb: price change ≈ −duration × change in rates. The three bonds above have a duration (strictly, a modified duration) of about 1.9, 8.5 and 19.6 years, so for a one-point rise the rule gives falls of about 1.9 %, 8.5 % and 19.6 %, against the exact 1.9 %, 8.1 % and 17.3 % in the table.
The rule works for funds as well. A bond fund with a duration of 17 years loses roughly 17 % if long-term rates rise by one percentage point (approximation). That is interest rate risk in a single figure, and every bond fund publishes its duration on its fact sheet. FINRA, the US Financial Industry Regulatory Authority, explains the measure in its investor article Brush Up on Bonds: Interest Rate Changes and Duration.
Bond duration vs maturity
Maturity is the date the money comes back. Duration measures how sensitive the price is to a change in rates. For a bond that pays coupons, duration is shorter than maturity, because part of the money comes back earlier through the coupons: the 30-year bond above has a duration of about 19.6 years, not 30.
*Illustration, annual coupons, no costs or taxes.*
What happens to bond prices when interest rates rise: the real record
This is what the arithmetic did to long-term US Treasuries in our data, measured by TLT, a fund of US government bonds with 20 or more years to maturity.
- Calendar years 2003–2025: 16 of 23 were positive. The best, 2008 and 2011, gained about 34 % each. The worst was 2022, at −31.2 %.
- The fall from the high: from July 2020 to October 2023 long Treasuries fell 47.8 %, and by June 2026 they were not back at the high (weekly closes, total return).
Two things came together. These bonds have 20 or more years to maturity, so each point of rate change moves their price a long way, as in the 30-year line of the table. And rates rose after four decades of moving the other way: the 10-year US Treasury yield was above 15 % in 1981 and about 0.5 % in 2020 (FRED, series DGS10). Falling rates lifted bond prices for four decades; from 2022 that tailwind reversed.
Long-term US Treasuries carry practically no default risk (the risk that the issuer does not pay), but their prices react strongly to changes in long-term interest rates. Safe from default is not the same as safe from rising rates. Every calendar year and every fall are on our US Treasuries market page, and our guide to maximum drawdown explains how a fall from the high is measured.
*Past returns do not guarantee future results.*
Bonds held to maturity vs bond funds
A single bond and a bond fund behave differently when rates move.
An individual bond. A high-quality bond that is held to maturity pays its coupons and then its face value, whatever the price did in between. In the worked example, the holder of the 3 % bond sees the price drop to about $919 when rates go to 4 %, but still receives $30 a year and $1,000 at the end. The fall is a paper loss for as long as the bond is not sold. It has a cost all the same: the money stays tied up at 3 % while new bonds pay 4 %.
A bond fund. A fund replaces its bonds as they age, so it keeps a roughly constant duration and never matures. There is no date on which it pays back a face value. A price fall shows up in the fund's value, and the recovery comes through higher income over time, as the fund buys new bonds at the higher rates.
Neither form removes interest rate risk. Credit risk, the default risk of other issuers, is a separate subject and is not covered in this guide.
When stocks and bonds fall together
Bonds are held in a mixed portfolio to cushion the falls of stocks. The classic version is the 60/40 portfolio: 60 % stocks, 40 % bonds.
In 2022 both fell. The S&P 500 lost about 18 % in the calendar year and long Treasuries 31.2 %. For a 60/40 portfolio of US stocks and 10-year Treasuries, 2022 was the third-worst year in a century and a half, behind only 1931 and 1937.
The reason is the subject of this guide. When growth is the main worry, a weak economy hurts stocks but helps bonds, because interest rates fall. When rising inflation and rising rates are the cause, the same rate rise pushes bond prices down, and the mix is hit twice: through the stocks and through the bonds that were meant to cushion them.
Whether bonds move with stocks or against them is measured by the correlation between the two; our stock–bond correlation guide explains when bonds have protected stocks and when they have not, and the correlation matrix shows the figures for 30 markets. A diversified mix can hold more than stocks and bonds, for example cash and gold; our guide to gold versus bonds describes what each did in past periods, and the free Portfolio Crash Test shows how a 60/40 portfolio, 100 % stocks and mixes with gold held up in every big sell-off since 1972.
*Past returns do not guarantee future results.*
Do bonds go up when interest rates go down?
Yes. The arithmetic runs both ways. In the worked example, the 3 % bond is worth about $1,090 when market rates fall to 2 %, about $90 more than its face value. The record shows the same direction: the best calendar years for long Treasuries in our data, 2008 and 2011, were years in which long bonds gained about 34 %.
Rising rates have another side as well. A price fall is the cost carried by money that is already invested; new money and every reinvested coupon earn the higher rate from then on. The Federal Reserve Bank of St. Louis gives an example in its explainer Why Do Bond Prices and Interest Rates Move in Opposite Directions?: a 5-year Treasury note bought in May 2020 paid a 0.34 % coupon, one bought in May 2023 a 3.58 % coupon. For a long-term bond investor, a rise in rates means a lower value today and a higher income over time.
None of this says where rates go next.
*Past returns do not guarantee future results.*
Frequently asked questions
Why do bond prices fall when interest rates rise?
Because a bond's coupon is fixed. When new bonds pay a higher rate, an existing bond with a lower coupon is only worth buying at a lower price, so its price falls until its yield matches the new rate.
Do bonds go up when interest rates go down?
Yes. When new bonds pay less, an existing bond with a higher coupon is worth more. In our illustration (annual coupons, no costs or taxes), a 10-year $1,000 bond with a 3% coupon is worth about $1,090 at a market rate of 2%.
What is the difference between bond duration and maturity?
Maturity is the date on which a bond repays its face value. Duration measures how much the price changes when rates change. For a bond that pays coupons, duration is shorter than maturity. Every bond fund publishes its duration on its fact sheet.
How much does a bond fall if rates rise 1%?
Roughly its duration in percent: price change ≈ −duration × change in rates. In our illustration (3% coupon, annual coupons, no costs or taxes), a rise from 3% to 4% takes about 1.9% off a 2-year bond, about 8.1% off a 10-year bond and about 17.3% off a 30-year bond. A bond fund with a duration of 17 years loses roughly 17% (approximation).
Why did bonds fall so much in 2022?
Interest rates rose, and the longer a bond's maturity, the bigger the price change. Long-term US Treasuries (TLT, US government bonds with 20+ years to maturity) lost 31.2% in the 2022 calendar year, the worst year in our data from 2003 to 2025, and fell 47.8% from July 2020 to October 2023 (weekly closes). Before that, the 10-year US Treasury yield had fallen from above 15% in 1981 to about 0.5% in 2020. Past returns do not guarantee future results.
If I hold a bond to maturity, does the price change matter?
A high-quality bond that is held to maturity pays its coupons and its face value whatever the price did in between, so a fall in price is a paper loss for as long as the bond is not sold. The price change still shows what the holder gives up: the money stays tied to the old coupon while new bonds pay more. A bond fund never matures, so there the price change shows up in the fund's value.
Cite or link this guide
Writing about this topic? You are welcome to quote the figures with a link to this page. Click a box to copy.
Citation (APA)
Hamann, H. (2026). Why are bond prices and interest rates inversely related?. InvestWealth.com. https://www.investwealth.com/learn/guides/bond-prices-and-interest-rates
Link (HTML)
<a href="https://www.investwealth.com/learn/guides/bond-prices-and-interest-rates">Why are bond prices and interest rates inversely related?</a> (InvestWealth.com)
Check the hedge before you rely on it
- Hedge Health: one reading of whether bonds are protecting stocks
- Correlations between the asset classes, on current data
- Drawdowns: how far six core markets are below their highs, daily
Related guides
What a 60/40 portfolio is, its historical returns and worst years, why it failed in 2022, and how to tell when stocks and bonds stop protecting each …
Stock–bond correlation: when bonds protect stocks, and when they don'tWhat the stock–bond correlation measures, why it flips between negative and positive, which assets protected a portfolio in each regime since 1955, a…
Gold vs bonds: which protects a portfolio better in a crash?Gold rose 138% in 1973–74 when bonds failed, then fell 46% in 1980–82. Every big sell-off since 2007 and 150 years of data: when each hedge worked.
Daily, monthly or yearly compounding, with monthly contributions.
Investment calculator with dividend reinvestmentReinvested vs paid out, plus the real S&P 500 history.
Portfolio Crash TestHow your mix would have held up in every big crash since 1972.
Educational research, not investment advice. Disclaimer.